Alert Manager Enterprise 2.0 Released
Alert Manager Enterprise for Splunk has been a go-to solution for organizations looking to manage and respond to critical events effectively. With the release of version 2.0, Alert Manager has undergone a significant transformation, introducing a sleeker user interface, dark mode support, and a host of enhanced features that promise to streamline your event management processes. In this blog post, we’ll dive into the new and improved aspects of Alert Manager Enterprise 2.0.
A Fresh, Slick User Interface
The most noticeable change in this release is the updated user interface. Alert Manager Enterprise 2.0 has embraced a sleek and modern design, making your experience smoother and more intuitive. The switch to Splunk UI components brings a familiar and cohesive look that integrates seamlessly with your existing Splunk experience.
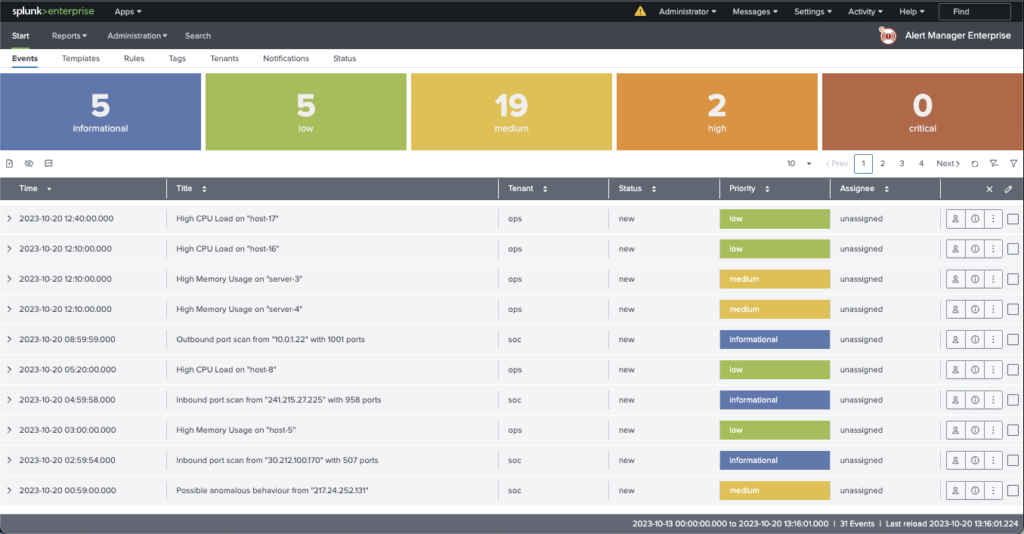
With the UI overhaul, users can navigate and manage events more efficiently.
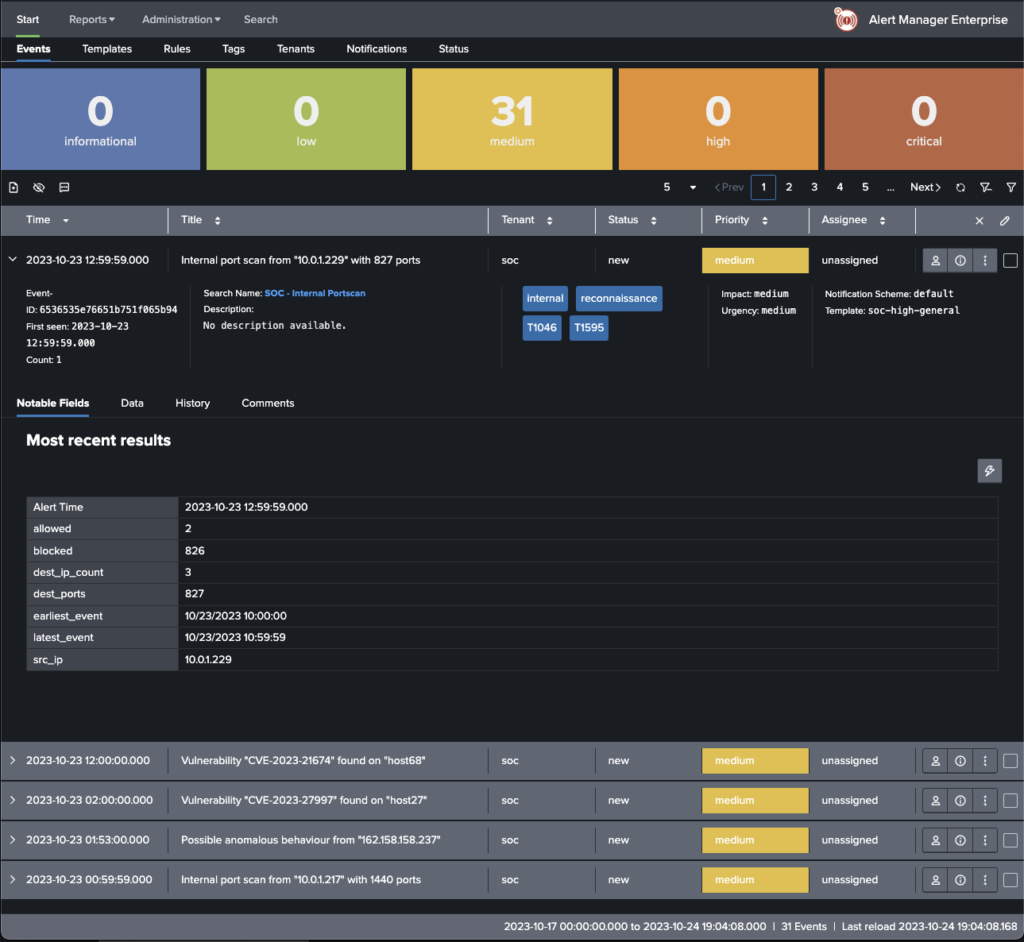
Dark Mode for Night Owls
Alert Manager Enterprise offers UI-theming support (Dark Mode FTW!) for those who prefer working in low-light conditions or enjoy the stylish aesthetics of a dark interface.
Maximize Screen Real Estate
In Alert Manager Enterprise 2.0, users can hide single-value indicators, providing maximum screen real estate for their events.
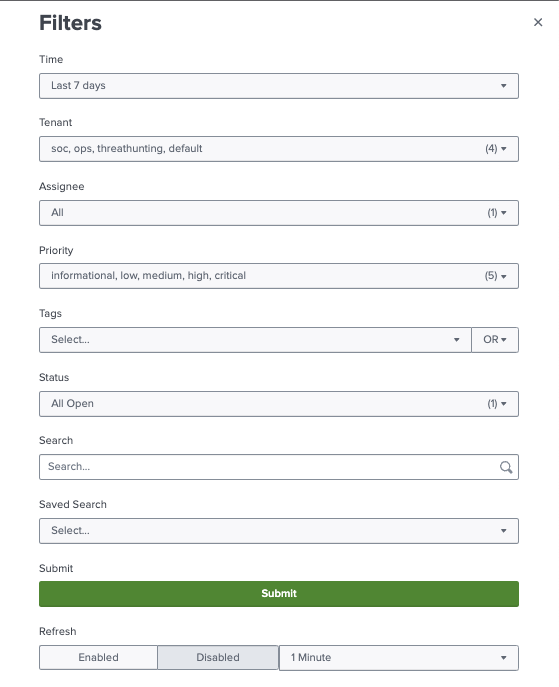
Streamlined Event Filtering
We have given event view filters a makeover as well. The filters are now hidden in a slide-out, offering a more streamlined and cleaner interface. We have also improved filtering based on event data!
Event Table Sorting
In response to user feedback and as a testament to our commitment to improving user experience, we have added table sorting to the Event Summary.
Information at Your Fingertips
We have added a footer in Alert Manager Enterprise 2.0 that a user can hide. Still, when displayed, it provides essential metadata for the events summary, such as when the summary was reloaded automatically or by a user, the time range, and the number of events found.
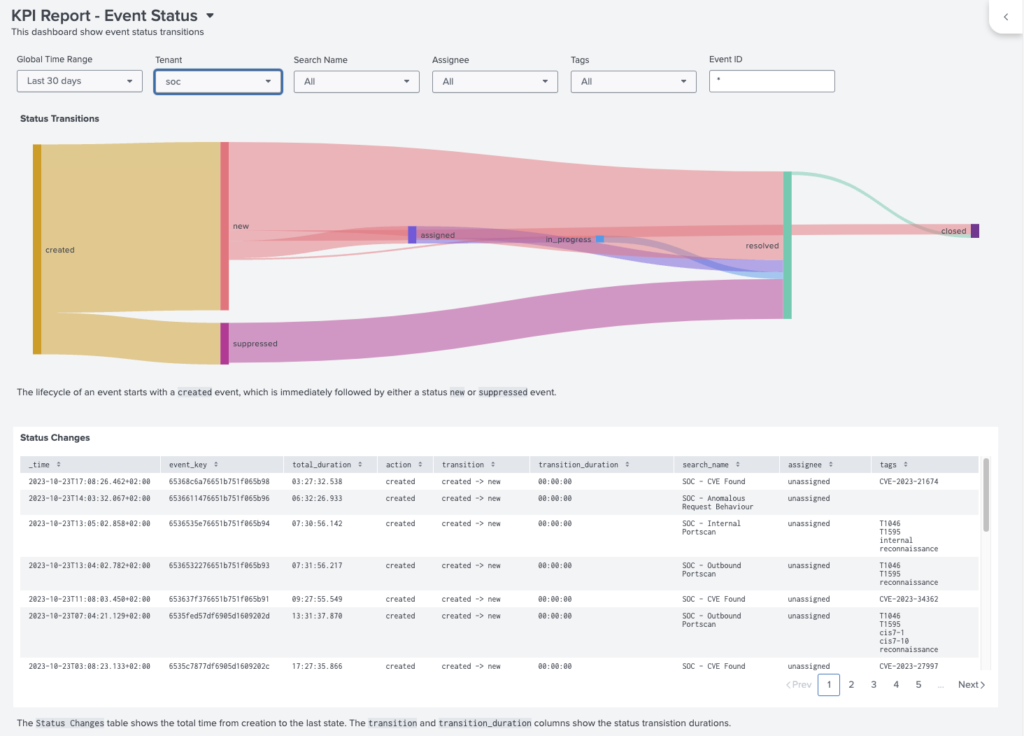
New Reporting Dashboard: State Transitions
Alert Manager Enterprise 2.0 introduces a redesigned KPI dashboard featuring a Sankey chart to enhance reporting. The dashboard helps you understand event lifecycles to improve operational efficiency.
Improved Reporting Commands
Creating custom reports is now more straightforward with the improved reporting commands in Alert Manager Enterprise 2.0. These commands allow you to tailor your reports to your specific requirements, providing the flexibility to analyze your data in a way that suits your organization’s unique needs. It’s also possible to add your custom dashboards to Alert Manager Enterprise.
Conclusion
The release of Alert Manager Enterprise 2.0 for Splunk marks a significant step forward in event management and incident response workflows. With its sleek new UI, support for dark mode, enhanced event filtering, metadata presentation, Sankey charts, and improved reporting commands, this update makes managing alerts and events even more effortless. Combining user-friendly design with powerful functionality, Alert Manager Enterprise 2.0 is a must-have tool for businesses prioritizing effective event management.
Download our latest release vom Splunkbase now!